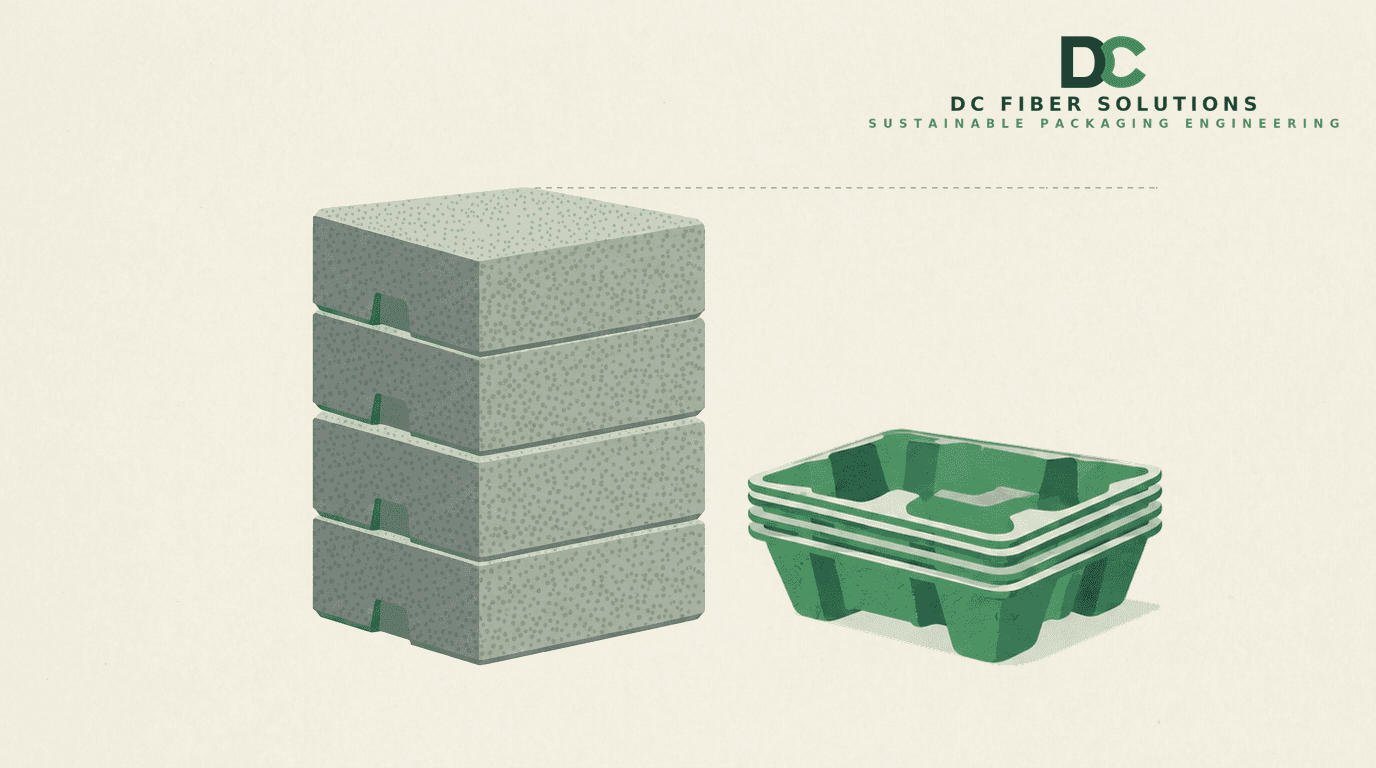
This question comes up in almost every conversion project, and it is almost always framed the wrong way — as a straight material-versus-material comparison, the way you would compare PP to PET.
It isn’t one. EPS is a single, highly standardised process. Molded fiber is a family of four distinct product types, running on raw material of widely varying quality, and those two choices together set the wall thickness, the part weight and therefore the price. Two suppliers quoting “molded fiber” for the same product may be quoting fundamentally different parts.
So the real question is not “EPS or fiber?” It is “which fiber type, on what raw material — and does that combination beat EPS on total landed cost and protective performance for this specific product?”
Here is how I work through it.
In short, if you are scanning: molded fiber is four different manufacturing methods, not one material, and the type you are quoted changes wall thickness, tolerance, nesting and price. Raw material quality sets the wall thickness a supplier can actually hold, which sets part weight, which sets your price. The logistics and EPR-fee differences usually decide the business case, not the piece price. And fiber’s protective performance is a design outcome rather than a material property — which is why the same product returns three different test results from three suppliers.
1. EPS Is One Process. Molded Fiber Is Four Types.
EPS is pre-expanded polystyrene beads steam-fused in a mold. Density and wall thickness are selected, and mechanical behaviour follows from those two choices in a well-documented way. Tooling is comparatively simple and cost modelling is straightforward.
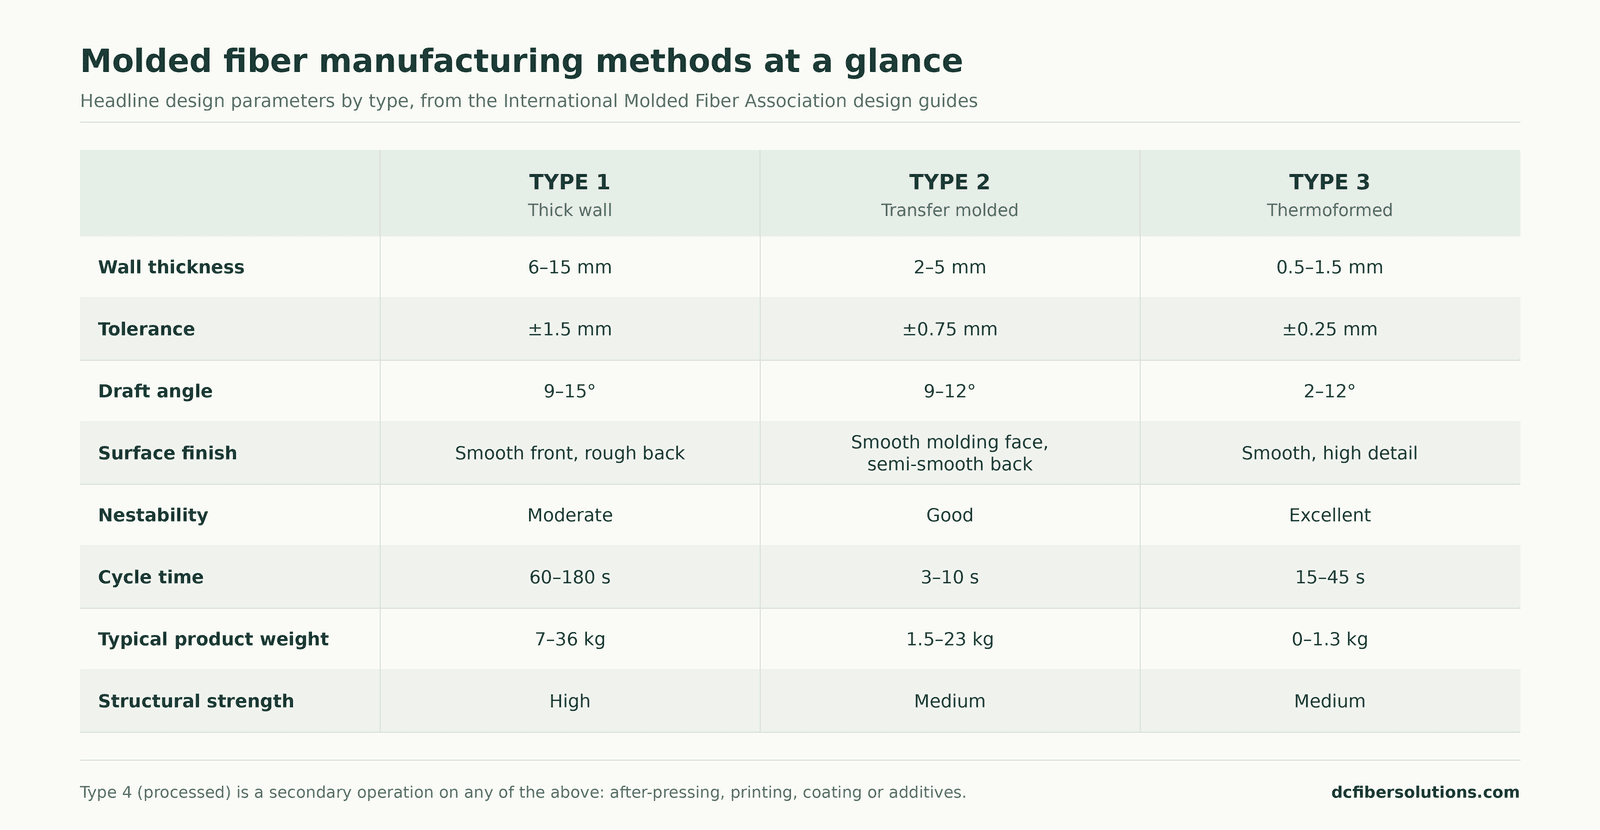
Molded fiber is classified into four manufacturing methods, and they are not interchangeable. The International Molded Fiber Association publishes design and manufacturing guides for each; the headline parameters are worth having in front of you before any conversion discussion:
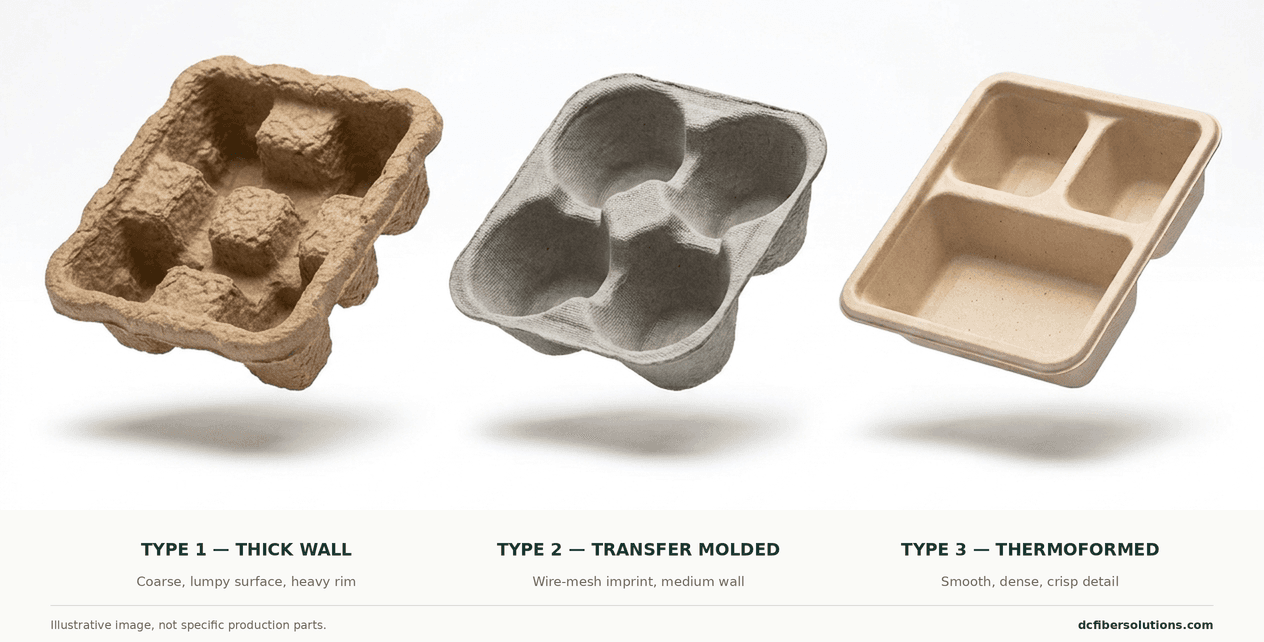
Type 1 — Thick Wall. Formed on a wet forming mold only, released, and oven-dried. No transfer stage and no pressing operation. The forming-mold face is the controlled, relatively smooth one; the free face stays rough and fibrous. Highest structural strength of the three and the lowest tooling cost, but also the slowest cycle and the loosest tolerance. Industrial packaging for vehicle parts, motors, furniture, heavy bottles and paper rolls.
Type 2 — Transfer Molded. A wet forming mold picks up the pulp and a wet transfer mold takes the part off it for oven drying — a dual-mold process. The workhorse: egg and fruit trays, light electronics and appliance packaging, bottle protection, hospital disposables. Cycle times are by far the fastest of the three and machine output the highest, which is why it dominates by volume.
One practical warning on the surface. The molding face is genuinely smoother than Type 1 and the back is semi-smooth — it is not a Type 3 finish on either side. If a customer has been led to expect thermoform-grade surfaces from a transfer-molded part, the expectation fails at first-article approval, and by then the tool exists.
Type 3 — Thermoformed. Sometimes called “precision.” The part is formed wet and then dried and cured inside heated molds rather than in an oven. Tightest tolerances, finest detail, thinnest walls, lowest draft requirement, and the best nesting of the three. It is also the lowest-throughput method, which is part of why it costs more. Food service, high-end retail and cosmetics packaging, premium electronics.
Type 4 — Processed. Any of the above with a secondary operation: after-pressing, printing, coating, additives. After-press matters more than it sounds — on high-speed lines with an inline after-press, thinner and flatter sections become viable than the conventional ranges above would suggest.
A note on naming. Suppliers rarely quote using these type numbers. They use commercial names — “wet press,” “hot press,” “dry press,” “precision,” “premium fiber” — and those names are not applied consistently between manufacturers. I have worked in plants where “wet press” meant the oven-dried process and “thermoform” the in-tool-dried one; elsewhere the same words mean something else. Do not compare the names. Ask each supplier three questions: is the part dried in an oven or inside the tool, is there a transfer stage, and is after-press included.
The shortcut. If you want one line that tells you roughly where your product sits before any conversation with a supplier, use the product weight row above. Heavy industrial goods point to Type 1, mid-weight consumer and appliance products to Type 2, light retail or food-service items to Type 3. The rest of the specification follows from there.
One caveat on the draft angle row. Those are design-guide figures, and they are deliberately conservative. What is actually achievable depends on radius transitions, part depth and overall part size rather than on any single number. In production I have run parts down to around 3° on both wet-press and thermoformed tooling, where the geometry genuinely left no alternative. But pushing the angle is never free — demoulding difficulty, tool wear and scrap rate all move in the wrong direction — and as a working industrial rule I would not design below 6–7° unless forced to. Treat the published range as where you should be, and the low end as where an experienced designer can take you when the product gives you no choice.
2. Why “Is Molded Fiber More Expensive?” Has No General Answer
For EPS, unit cost is reasonably predictable once density and geometry are fixed. For molded fiber it is the output of a longer list of variables, most of them decided during design rather than during sourcing:
Part weight. The dominant driver. You are paying for the mass of pulp consumed and the energy needed to drive the water out of it. The same geometry, designed by two engineers, can differ substantially in weight, and that difference flows into piece price for the life of the project.
Raw material quality — and the wall thickness it permits. This is the variable buyers almost never see. Long-fibre grades bond strongly enough to hold a thin wall; short, over-processed fibre from mixed recovered stock does not, and the section has to be put back to reach the same load capacity. Because wall thickness sets part weight, and part weight sets price, the furnish a supplier is running quietly determines what they can quote. Two suppliers can offer the same geometry at very different weights simply because they are buying different fibre.
Product type. Tooling investment and cycle time differ by a wide margin from Type 1 to Type 3.
Cavitation and cycle time. Parts per cycle determines effective cost per unit.
Drying energy. Water removal is the dominant energy cost in molded fiber, and it scales with wall thickness — which is why energy prices move fiber cost structures more than they move many alternatives.
Treatments and additives. Sizing for moisture or oil resistance, barrier coatings. These add cost and can push the part toward a worse recyclability classification, with its own regulatory cost (section 4).
Tooling amortisation against annual volume. A Type 3 tool amortises badly at low volume. At modest quantities a Type 2 part can be cheaper in total than a Type 3 part with a lower piece price.
The practical consequence: a single “molded fiber price” does not exist until type, raw material and target wall thickness are fixed. A quote arriving before those are defined is an estimate of something nobody has specified.
And one question worth asking any supplier who returns an unusually low piece price: what raw material is that weight based on, and what scrap rate is built into it? A low quoted weight resting on an optimistic raw material assumption does not stay a low weight. It becomes a yield problem first and a price revision second — usually after the tool has been paid for.
3. The Logistics Argument That Rarely Makes It Into the Comparison
This is where many conversion business cases are actually won, and it is routinely left out because procurement compares piece price and stops there.
The technical literature puts the difference plainly: molded pulp products nest; EPS parts rarely do. But it is worth being precise about how much, because it varies by type — IMFA rates nestability as moderate for Type 1, good for Type 2 and excellent for Type 3. The advantage is real across the board and largest exactly where parts are thinnest and volumes highest. That property compounds — fewer inbound trucks per million parts, less warehouse footprint for the same weeks of cover, less line-side handling, lower storage damage.
There is a second, less obvious effect. A fitted fiber tray can often achieve equivalent protection at a lower profile than thick foam end caps, which shrinks the outer box itself, not only what sits inside it. That matters twice over: once in freight and warehousing, and again under the PPWR empty space ratio discussed in the next section.
Both effects have to be calculated for your own part — there is no transferable percentage, and you should be sceptical of anyone offering one. The method is simple enough. Ask the supplier for the nest pitch of the proposed part: the height each additional unit adds to the stack, as opposed to the part’s full depth. Those two numbers give you the stacking ratio directly. Convert it into units per pallet, pallets per truck and trucks per year; then run the identical calculation for the EPS part, including the different box sizes each option requires. That comparison, not the piece price, is usually where the business case is decided.
Nest pitch is not an accident of the material. It is set deliberately in the design, through draft angle and small stacking ribs that stop parts wedging into one another, so they separate cleanly on the packing line instead of jamming. If a supplier cannot tell you the nest pitch of a part they are quoting, that is worth noticing in itself.
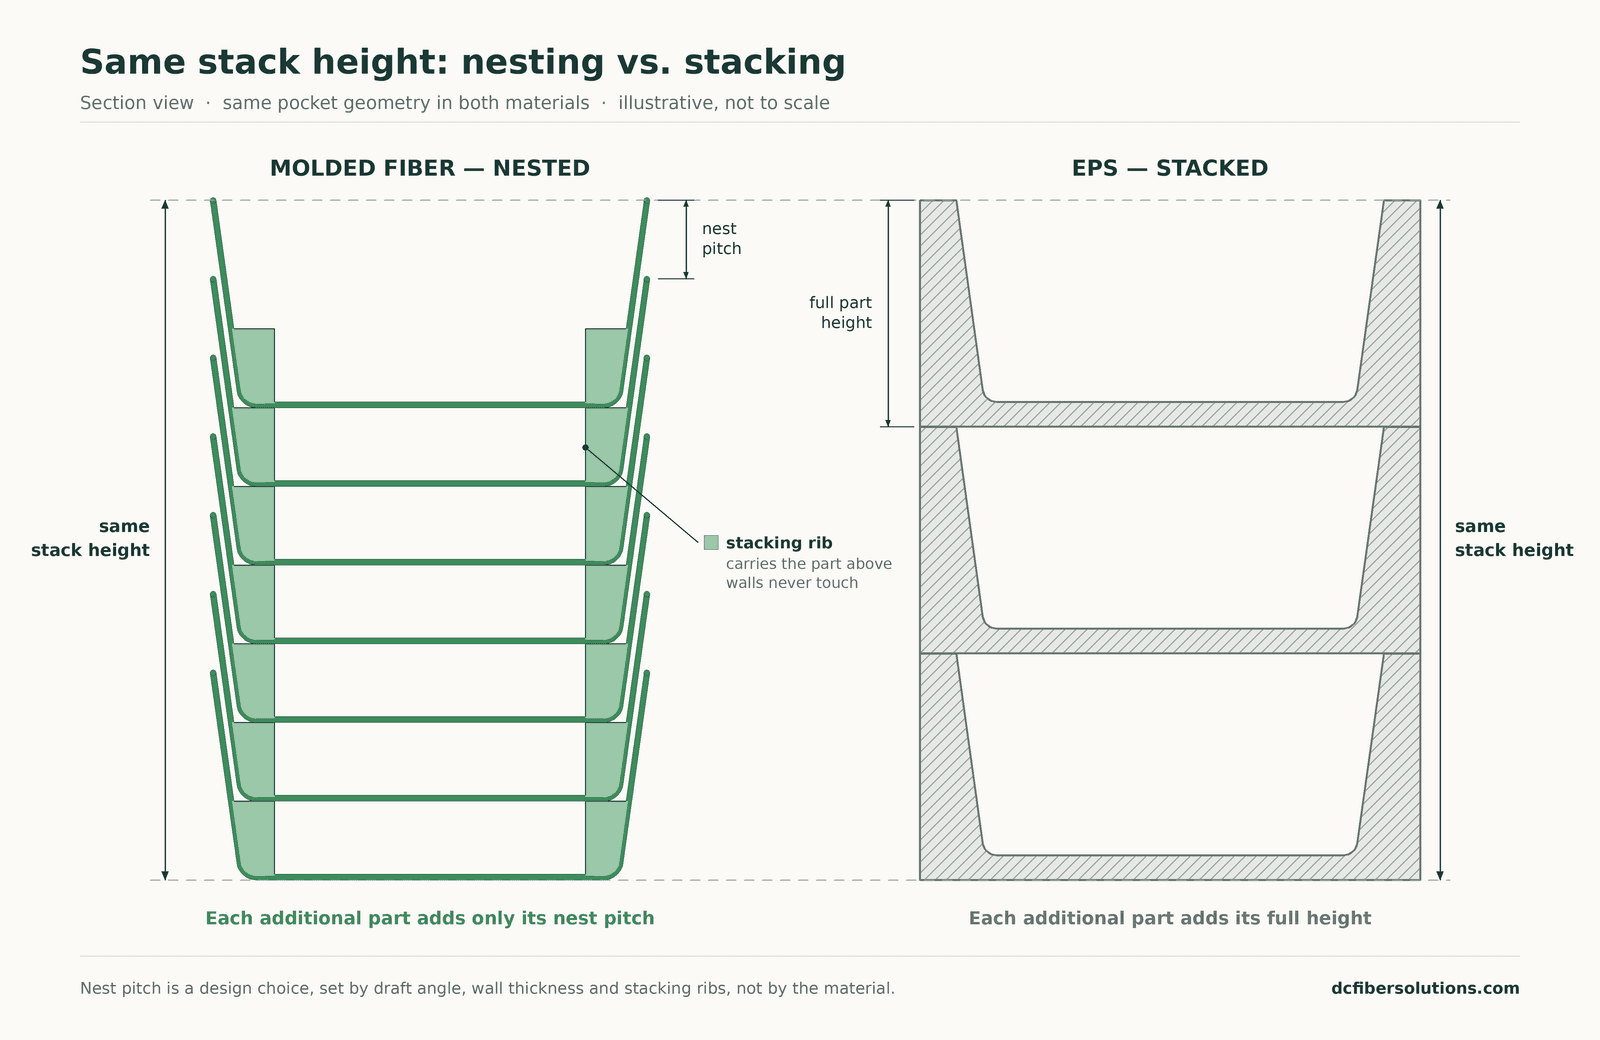
Two caveats, because this argument gets overstated. Nesting efficiency is a design outcome, not an automatic property of fiber — a part with poor draft and no deliberate nesting feature stacks almost as badly as foam, and a Type 1 part will never nest like a Type 3 one. And the calculation must run on delivered cost across the real supply chain, including distance from the manufacturer, not on a generic percentage.
4. Regulation: Not a Ban, a Compounding Cost
This is where I see the most inaccurate claims in the market, so it is worth being precise.
The EU’s PPWR (Regulation (EU) 2025/40, applicable from 12 August 2026) does not broadly ban EPS packaging. It makes hard-to-recycle packaging progressively more expensive and, eventually, non-placeable. Three mechanisms matter:
Recyclability performance grades. From 2030, packaging is graded on design-for-recycling performance: grade A at 95% or above, grade B at 80% or above, grade C at 70% or above. Packaging below grade C cannot be placed on the EU market. From 2035 the assessment extends beyond design to whether the packaging is recycled at scale in practice. From 2038 only grades A and B remain compliant.
Eco-modulated EPR fees. The same grades modulate Extended Producer Responsibility fees, so lower-performing packaging attracts higher fees. This is a recurring, per-unit cost that scales with volume — it changes the material comparison directly, every year, without any ban being required.
The empty space ratio. Single-use grouped, transport and e-commerce packaging faces a maximum 50% empty space ratio, applying from January 2030 (or three years after the relevant implementing acts, whichever is later), with the Commission due to establish the calculation methodology by 12 February 2028. Void-fill materials — foam, bubble wrap, air cushions — are counted as empty space rather than as content.
That third mechanism connects back to section 3: thick EPS end caps force a larger outer box, raising the volume the ratio is calculated on, while a lower-profile fitted tray shrinks the box itself. How fitted protective inserts — fiber or foam — will be classified is exactly the kind of detail the implementing acts will settle. Worth monitoring; not worth assuming.
And the honest counterweight: none of this prohibits EPS as a material. Some individual markets go further on their own — several US states have banned EPS foodservice packaging outright, and France legislated a broader EPS ban before rolling it back to align with the EU timeline. If someone tells you EPS is “now illegal,” ask which jurisdiction and which packaging category. The picture is a patchwork.
5. Cushioning: A Material Property vs. a Design Outcome
This is the part of the comparison most often handled badly, and it is the main technical reason conversions fail.
For EPS, cushioning is a material property. Published cushion curves give peak deceleration against static stress for a given density, thickness and drop height. The designer selects density, bearing area and thickness, reads the curve, and has a defensible prediction before any part exists. Decades of data, low design risk. (Worth noting, since it is frequently misstated: these curves are not linear. They are characteristically U-shaped — high peak G at low static stress, a minimum in the working band, rising again as the material bottoms out. Landing the bearing area in that band is the whole design exercise.)
For molded fiber, there is no equivalent universal curve — and this is not an opinion. Published research comparing the two directly found that the cushioning performance of a molded pulp cushion “was affected more by the structural factors of the structural unit than by the material characteristics,” and that its compression behaviour is governed by the geometric shape and depth of the structural unit rather than by material properties. The same study measured how much less predictable this makes fiber: a coefficient of determination of approximately 0.8 for molded pulp against 0.98 for EPS.
To be clear about what that number is, because it gets badly misquoted: R² describes how closely measured behaviour follows a fitted curve. It is a measure of predictability, not of protection. An R² of 0.8 does not mean molded fiber delivers “80% protection,” and it does not mean EPS behaves linearly. It means fiber’s cushioning response is materially harder to predict from a curve than EPS’s is — a statement about design risk, not about performance ceiling. A well-designed fiber part can outperform foam; you simply cannot read that performance off a chart before the part exists.
The mechanism is progressive structural collapse — elastic, then buckling, then densification — rather than the uniform cellular compression of a foam.
And there is a second reading of the same finding that is easy to miss. A cushion curve tells you exactly what a given EPS grade will do — and in the same breath, that it will never do more. The performance is capped by the material, and the designer’s role is to select from a catalogue of densities. Fiber is the opposite: because the performance comes from structure, it is bounded by the quality of the design rather than by the furnish. Stiffening geometry, crush zones, contact area and wall angles are all levers. Predictability is EPS’s advantage. Headroom is fiber’s.
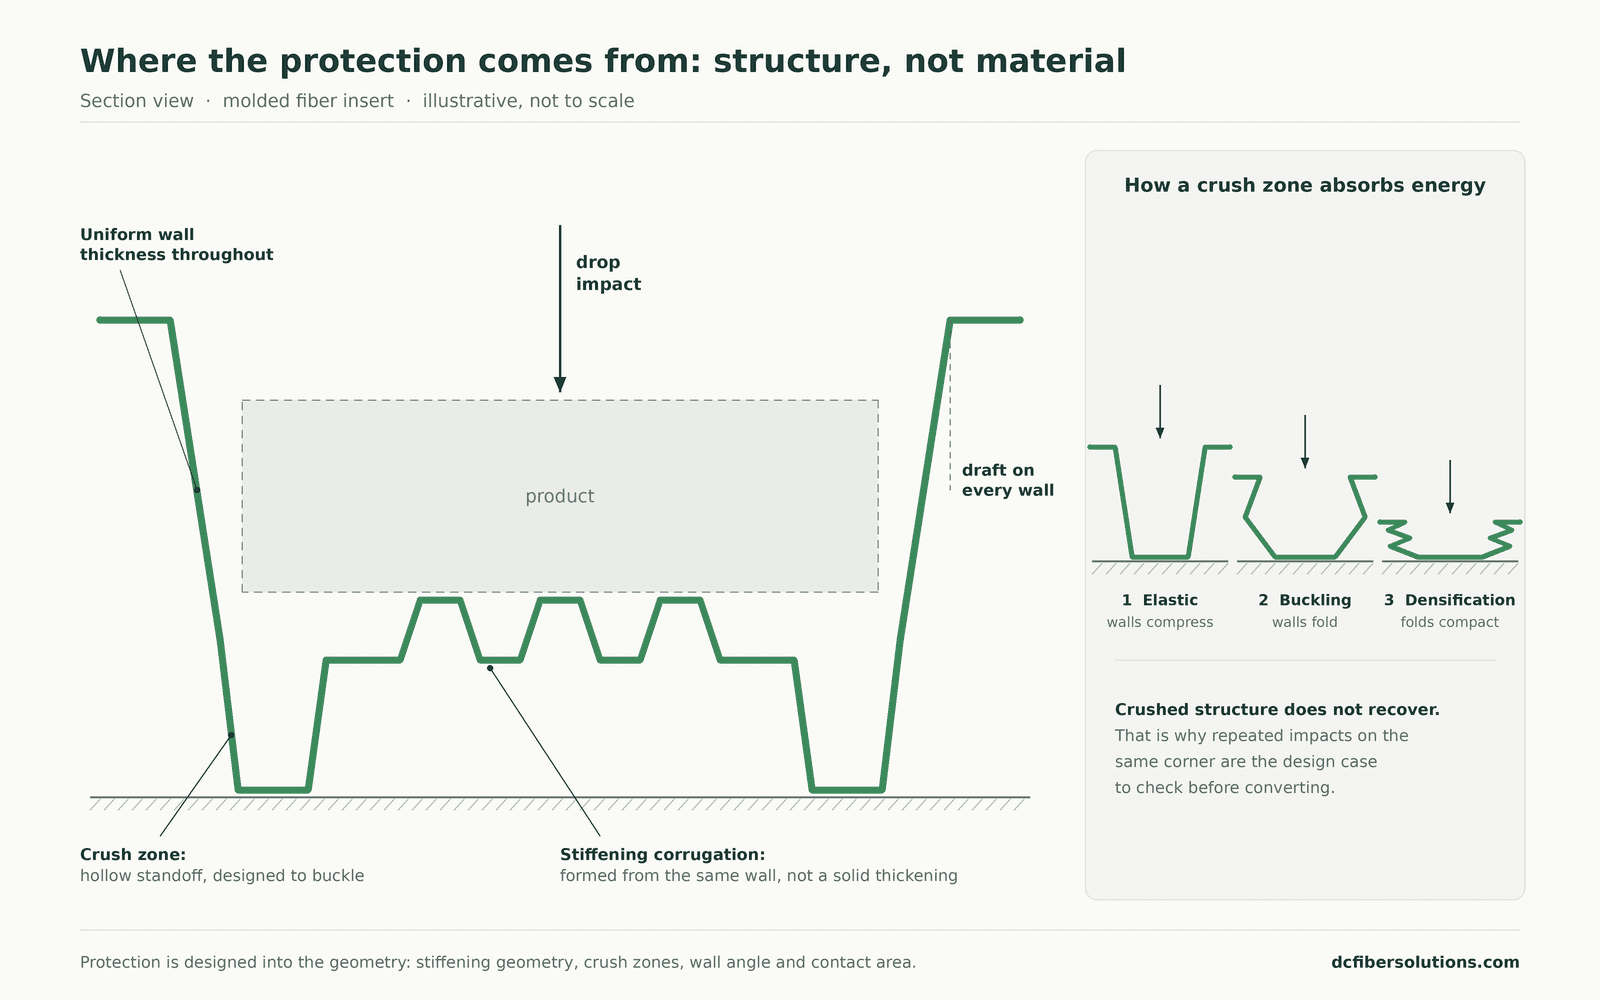
Three practical implications follow:
Molded fiber cushioning is a design capability question, not a material question. This is precisely why the same product, sent to three suppliers, comes back with three different test results.
A well-engineered fiber insert can match or beat foam across a broad range of applications. A poorly engineered one will genuinely underperform a well-designed foam part, in a way that is not obvious until drop testing.
Drop testing (ISTA 3A, or the sequence relevant to your distribution channel) is not optional in a conversion. Assuming the supplier will resolve it during trials is the most common cause of failed and expensive conversion projects.
6. Where Molded Fiber Is the Better Answer
The mirror of the section that follows. These are the cases where I would push the conversion, and why.
Anything sold into a market with eco-modulated EPR fees. This is the cost line most procurement models miss, because it does not look like a packaging cost. It is recurring, it scales with volume, and unlike tooling it never amortises away. Over a multi-year project life it is frequently the largest single cost difference between the two materials — and it moves in one direction only.
High-volume protective parts, on any route where freight matters. Trucks carrying protective packaging cube out long before they weigh out. That makes EPS’s low weight much less of an advantage than it appears on a datasheet: you are paying to move and store air. Nesting attacks the constraint that actually binds.
Heavy industrial goods — which is where fiber is strongest, not weakest. This runs against the common assumption, so it is worth stating plainly: IMFA rates Type 1 structural strength as high, above both other types, for typical product weights of 7–36 kg. Vehicle parts, motors, furniture, heavy bottles, paper rolls. If someone has told you fiber cannot handle weight, they were describing Type 3.
Consumer-facing packaging where the opening experience is part of the product. Type 3 holds ±0.25 mm tolerance with high surface detail. Appearance stopped being the compromise it once was, which removes the historical reason premium products stayed in foam or vacuum-formed plastic.
Anywhere the outer box can shrink. A lower-profile fitted tray reduces the carton itself, which pays three times: freight, warehouse footprint, and the PPWR empty space ratio in section 4.
Products where the protective requirement is demanding enough to be worth engineering. This follows directly from section 5. Because fiber’s performance comes from structure rather than material, a competent design has headroom — stiffening geometry, crush zones, load redistribution. With foam you select a density from a catalogue and that is the ceiling. The harder the protective problem, the more that difference is worth.
There is also a reporting dimension worth noting without overstating it: fewer trucks is fewer trucks, and for companies reporting transport emissions that arithmetic shows up in a place the finance team already looks.
7. Where I Would Still Specify EPS
Part of working independently, rather than for a manufacturer of one material, is being willing to say that fiber is the wrong answer. Cases where I would not push a conversion:
Repeated-impact distribution profiles. The research above found directly that repeated impacts, higher static stress and greater drop height all reduced molded pulp cushioning performance, and that strength and resilience are expected to decrease under repetitive loads. Fiber absorbs energy by buckling and crushing, and crushed structure does not recover. Where a test sequence involves multiple drops on the same corner, this must be designed around explicitly or the conversion is a bad idea.
Sustained moisture or high humidity without a treatment strategy. The same conclusion applies to humidity. This is measurable and designable — sizing agents, raw material selection, conditioning — but it has to be addressed deliberately, and treatment carries both a cost and a potential recyclability consequence.
Temperature-controlled distribution. EPS is a genuine thermal insulator, and that is a functional requirement rather than a preference in cold-chain food, pharmaceutical and diagnostic shipping. Molded fiber does not substitute for it.
Very low static stress applications. Very light, very fragile items need large, thin spans in fiber, which buckle less predictably than a low-density foam of the correct grade.
Geometry the process cannot produce. Molded fiber needs draft on every vertical surface, and it does not like deep narrow cavities, sharp internal corners, or undercuts. EPS tooling accommodates complex internal geometry far more readily. Draft itself is negotiable in experienced hands, as noted in section 1 — but it is negotiated against scrap rate and tool life, not waived. If your product form was designed around foam, expect the draft requirement to open a redesign conversation early rather than late. If the product form genuinely demands those features and cannot be redesigned around them, no amount of fiber engineering fixes it — and a supplier who accepts that geometry without raising it is telling you something about how the project will go.
Very high volume, very thin margin, with no regulatory exposure. If the product is not sold into a market where EPR modulation and recyclability grading will bite, and the piece-price delta survives the logistics calculation in section 3, the business case may simply not be there.
8. Five Claims to Be Careful With
These circulate widely enough in conversion discussions to be worth addressing directly. Each is the kind of statement that, used in front of a technically competent audience, damages the case it was meant to support.
“Molded fiber automatically achieves PPWR Grade A.” It does not. Grade A requires 95% or better recyclability performance. Coatings, laminates, additives and contamination all affect the outcome, and from 2035 the assessment includes whether the packaging is recycled at scale in practice, not only whether it is designed to be. Paper-based packaging has a real structural advantage in an established recycling stream — that is not the same as a guaranteed grade, and no one should be promising a client a grade before the part and its treatments are defined.
“R² ≈ 0.80 means molded fiber provides 80% protection.” It does not, as covered in section 5. R² is a goodness-of-fit measure describing predictability. Quoting it as a protection percentage is a straightforward misreading, and it will be recognised as one.
“Switching to fiber saves up to 70% of warehouse space.” Nesting pitch is a function of part geometry and draft angle, not of the material. There is no transferable percentage. The saving is real and often substantial, but it has to be calculated for the specific part.
“FEA removes the need for physical drop testing.” It does not. Simulation is genuinely useful for comparative work — stiffening layout, crush zone geometry, narrowing the design options before tooling. But the impact material model for wet-formed cellulose is not characterised anything like as well as it is for foam, and the research in section 5 shows why: performance is dominated by structural buckling behaviour that is difficult to predict. FEA reduces the number of physical iterations. Certified physical testing is what validates the design.
“Molded fiber is 100% recyclable and biodegradable, so you can say so on the pack.” Two separate problems. First, the material claim depends on the part: untreated fiber goes into the paper stream readily, but coatings, barrier treatments and additives can change both its recyclability and how, or whether, it breaks down. Second, the on-pack claim is now a legal question in its own right. From 27 September 2026, under Directive (EU) 2024/825, generic environmental claims made to consumers in the EU are prohibited unless the trader can demonstrate recognised excellent environmental performance, for example through the EU Ecolabel or an officially recognised EN ISO 14024 Type I ecolabel. The European Commission’s own examples of generic claims include “eco-friendly”, “green” and “biodegradable”. The rule covers business-to-consumer communication, so in practice it falls on the brand putting the claim in front of consumers. The switch to fiber can be a genuine improvement; what goes on the carton about it needs to be specific and substantiated.
9. The Questions That Actually Decide It
These are the inputs I would want before giving an opinion on any specific product:
Which markets is the product sold into, and what is the regulatory exposure — PPWR grading and EPR modulation, or something else?
What is the real distribution profile? Number of handling events, single versus repeated impact, typical rather than worst-case treatment.
What is the humidity and temperature exposure across the whole chain, including storage?
What annual volume, over what project life? This decides which type can amortise its tooling.
What fit and appearance requirement? Shelf-facing and tight tolerance points to Type 3; purely protective allows Type 2 or Type 1 at considerably lower cost.
What raw material will the supplier actually be running? This is the question that connects the technical answer to the commercial one.
Is piece price, total landed cost, or brand positioning the binding constraint for this product line?
Answer those honestly and the material decision — and more importantly the type decision inside molded fiber — usually becomes clear. What does not work is comparing a piece price for an unspecified fiber process against a known EPS cost and concluding anything from it.
One closing observation. Most products still packed in foam today were specified at a time when that was straightforwardly the right answer — before EPR fees were modulated by recyclability grade, before an empty space ratio existed, and before molded fiber could hold a quarter-millimetre tolerance. The material did not necessarily become wrong in the meantime. But the equation that produced the original decision has changed on several terms at once, and very few of those decisions have been revisited with the new terms actually in front of them.
That, rather than regulation as a threat, is usually the honest reason to look again: the specification is older than the constraints it now has to satisfy.
This is the kind of assessment that benefits from an independent evaluation — agnostic about material, process and supplier — rather than a recommendation from whoever happens to manufacture one of the options.
References
International Molded Fiber Association — Design Guides and Manufacturing Guides for Manufacturing Methods Type 1, Type 2 and Type 3. (Wall thickness, tolerance, draft angle, surface finish, nestability, cycle time and product weight ranges in section 1; nestability ratings in section 3.) imfa.org/education-hub
Didone, M. et al. Molded fiber and pulp products as green and sustainable alternatives to plastics: A mini review. Journal of Bioresources and Bioproducts. (Type 1–4 classification framework; nesting behaviour versus EPS.)
Analysis of Compression and Cushioning Behavior for Specific Molded Pulp Cushion. Korean Journal of Packaging Science & Technology. (Structural rather than material dominance of cushioning performance; R² 0.8 versus 0.98 for EPS; effect of repeated impacts and humidity.)
Regulation (EU) 2025/40 on packaging and packaging waste (PPWR) — recyclability performance grades, EPR fee modulation, empty space ratio.
Directive (EU) 2024/825 on empowering consumers for the green transition — generic environmental claims, applicable from 27 September 2026 (European Commission FAQ).
ASTM D1596 — Standard Test Method for Dynamic Shock Cushioning Characteristics of Packaging Material.
Process descriptions in section 1 follow IMFA’s published guides; commentary on surface expectations and commercial naming reflects production practice.
COMING NEXT
In the next post: how to tell which of the four molded fiber types your product actually needs, before you ask anyone for a quote.